Are You Really
Tracking The Right
Metrics For
Engineering
Success?
Let’s dive in!
Ready To Review Your Engineering Strategy?
Leading brands and innovative startups count on us.

Engineering Metrics Guide
For Agile Teams
Managing a project that involves both in-house resources and external resources, such as contractors, presents unique challenges. To ensure productivity and efficiency across your engineering efforts, it’s essential to track performance metrics that give you visibility into how all resources assigned to your project are contributing.
Whether your project uses Scrum, Kanban, or a hybrid approach, the following metrics will help you monitor task progress, workload distribution, and efficiency. Tools like Jira, Azure DevOps, Monday, ClickUp, etc, can collect the necessary data and provide automated tracking, helping you measure performance without needing additional third-party tools.
So, What’s This Guide All About?
This guide outlines the key engineering metrics, the minimal data required for tracking, automation suggestions, and useful resources to help you assess the performance of both in-house developers and external resources effectively.
Sonatafy Technology’s Director of Engineering Alex Ramirez
Tailoring Metrics for Your Team Setup
Since your project involves a combination of in-house developers and external contractors, you’ll want to assess how both teams contribute to overall progress.
Key considerations include:
- For contractors, focus on Lead Time and Defect Rate to monitor their speed and the quality of their work.
- For in-house teams, metrics like Velocity and Capacity Load can help you optimize internal resources for long-term sustainability.
- By breaking down metrics per resource, you can also identify which might need additional support, training, or more clearly defined requirements.
Context and Benchmarks
It’s useful to share industry benchmarks to help you understand where your project performance stands.
For instance, comparing your Velocity or Lead Time against industry standards for similar projects can provide insight into your team’s performance.
Additionally, make sure to interpret metrics in the context of your specific setup, This helps avoid misinterpretation and ensures expectations are realistic.
Customer-Focused Insights
While these metrics are valuable internally, they can also be used to communicate progress and quality to customers:
- Task Completion Rate can highlight the percentage of customer-facing deliverables completed within a set timeframe, demonstrating value being delivered.
- Trends in Defect Rate can be presented to customers as evidence of improving product quality, leading to fewer bugs in production.

Predictive Metrics for Future Planning
Predictive metrics can help you anticipate potential roadblocks:
- Use burn-up charts to monitor whether both teams are on track to meet delivery deadlines. (Usually, all Project Management tools provide these charts “out-of-the-box”)
- Trends in Lead Time or Task Completion Rates can help predict whether upcoming features will be delayed or completed on schedule.
Customers have different priorities based on their business goals and project types. It’s important to align engineering metrics with what matters most to your customers. Here are key considerations:
- For customers in highly regulated industries, Defect Rate may be critical to ensure quality and compliance.
- Customers focused on rapid delivery will benefit from metrics like Velocity and Lead Time to track how quickly their teams can release features.
Providing customized metrics dashboards can help external stakeholders easily view the data relevant to their objectives without diving into internal details.
Key
Engineering
Metrics
Task Completion Rate
Task Completion Rate (Resolved or Completed Tasks in a Quarter)
Measures: The number of tasks completed within a specific time period.
Why It Matters: This provides an overview of the work completed, but it’s important to avoid drawing direct conclusions about developer performance based solely on this number. Task complexity, dependencies, and defects encountered during development can impact completion rates.
How to Avoid Misleading Interpretations: To ensure that you are assessing performance fairly:
- Pair Task Completion Rate with Defect Rate: Track the number of bugs or issues encountered during task completion. Addressing defects or more complex tasks may result in fewer completed tasks. Use the Defect Rate (see below) to provide context for lower completion rates.
- Include Task Complexity Ratings: Not all tasks are equal. Assign a complexity level or story points to tasks so you can weigh the effort and time spent accordingly. This will help you compare performance based on the difficulty of the tasks, not just the number of tasks completed.
- Consider Cycle Time (Task Resolution Time): Combine Task Completion Rate with Cycle Time to see how long tasks take. If the Cycle Time is high but the Task Completion Rate is low, it could indicate a focus on resolving complex issues or defects rather than a slow performance.
-
- Minimal Input Needed: Task Start Date, Task End Date/Resolution Date, Story Points or Complexity Rating, Defect Data
- Automation: Configure your tool to track and report the number of completed tasks per quarter and include complexity levels or bug-fix efforts to add context.
- Resources: Task Completion Rate, Defect Management
Task Resolution Time
Task Resolution Time (Cycle Time)
Measures: Time taken to complete a task from start to resolution.
Why It Matters: This metric helps you understand which teams or individuals are resolving tasks efficiently and where potential bottlenecks might occur.
Minimum Input Needed: Task Start Date, Task End Date/Resolution Date
Automation: Use workflow transitions to capture start and end dates automatically, allowing you to measure how quickly work is being completed across different teams.
Resources: Cycle Time Calculation
Velocity
Velocity (Completed Story Points per Sprint)
(If using Scrum Framework)
Measures: Total number of story points completed by the team in each sprint.
Why It Matters: By tracking the velocity of your teams, you can monitor overall project progress and adjust sprint planning as needed.
Minimum Input Needed: Story Points, Sprint End Date
Automation: Configure your tool to sum completed story points at the end of each sprint automatically.
Resources: Measuring Agile Velocity
Capacity Load
Capacity Load Per Resource
Measures: Work assigned to each team member versus their available capacity.
Minimum Input Needed: Estimated Task Duration or Story Points, Available Capacity per Resource.
Why It Matters: This helps you manage workload distribution, ensuring no team member is overloaded or underutilized.
Automation: Use built-in capacity planning features in your tool to visualize workloads and adjust assignments accordingly, ensuring balanced workloads across your in-house and external teams.
Resources: Resource Capacity
Lead Time
Lead Time (from Task Creation to Completion)
Measures: Time taken from task creation to resolution.
Why It Matters: Lead time gives you visibility into how long it takes for tasks to move from inception to delivery, allowing you to monitor the efficiency of your entire engineering operation.
Minimum Input Needed: Task Creation Date, Task Resolution Date
Automation: Automate the recording of task creation and resolution dates within your project management tool.
Resources: Lead Time Measurement Guide
Defect Rate
Defect Rate (Bug Resolution vs. Creation)
Measures: Number of bugs created and resolved over time.
Why It Matters: The defect rate helps you understand the quality of work being delivered by each team. So you can address these issues early.
Minimum Input Needed: Bug Creation Date, Bug Resolution Date
Automation: Set up issue types for bugs and automate logging of resolution dates, while distinguishing between bugs handled by your resources.
Resources: Defect Management
Issue Type Distribution
Issue Type Distribution (Per Project)
Measures: Distribution of different issue types being worked on.
Why It Matters: This helps you see where the focus of your engineering efforts lies and whether your teams are balancing the right mix of work.
Minimum Input Needed: Issue Type
Automation: Utilize reporting features in your tool to visualize the proportions of various issue types.
Additional Recommendations for
Metrics Implementation

GitHub Insights
(GitHub’s Native Analytics)
Provides built-in insights for contributions, pull requests, issues, and more. Available for public repositories or with an Enterprise license.

GitHub API
Pull data programmatically using the GitHub REST and GraphQL APIs. Allows for building custom dashboards with tools like Python (using libraries like Requests or PyGitHub) or JavaScript. Free usage within GitHub’s rate limits.
Resources: GitHub REST API Documentation | GitHub GraphQL API Documentation

GitHub Actions
Automate data collection by scheduling workflows to fetch and log metrics. Combined with scripts in Python or JavaScript, it can pull data from the GitHub API for dashboard use.

Grafana
Visualize data from various data sources, including GitHub metrics. Connect Grafana to a database (like InfluxDB or Prometheus) where GitHub data is stored or use plugins.
Resources: Grafana Getting Started

Google Data Studio
Create dashboards by pulling data from external sources. Export GitHub data to Google Sheets and visualize it in Data Studio. Both tools are free to use.

Metabase
A free, open-source BI tool that connects to databases, including PostgreSQL or MySQL. Load GitHub data (via API or data pipeline) into a database for visualization.
Resources: Metabase

Countly
(Community Edition)
Offers analytics and can be adapted for GitHub metrics by creating custom event tracking. Self-hosted community edition is available.
Resources: Countly

Orbit
Designed to track community engagement and can pull in GitHub activity for community and contribution metrics. Free plan with basic functionality.
Resources: Orbit
Start Small
Focus on rendering the most critical metrics first before expanding your dashboard with additional metrics like defect rates and indirect response metrics to eventually derive DORA metrics.
Database Setup
Use the free API from GitHub to pull and dump metrics into a database of your choice.
Regular Updates
Use GitHub Actions to automate the pipeline for pulling GitHub metrics and updating your database.
Engineering Metrics Guide For Agile Teams
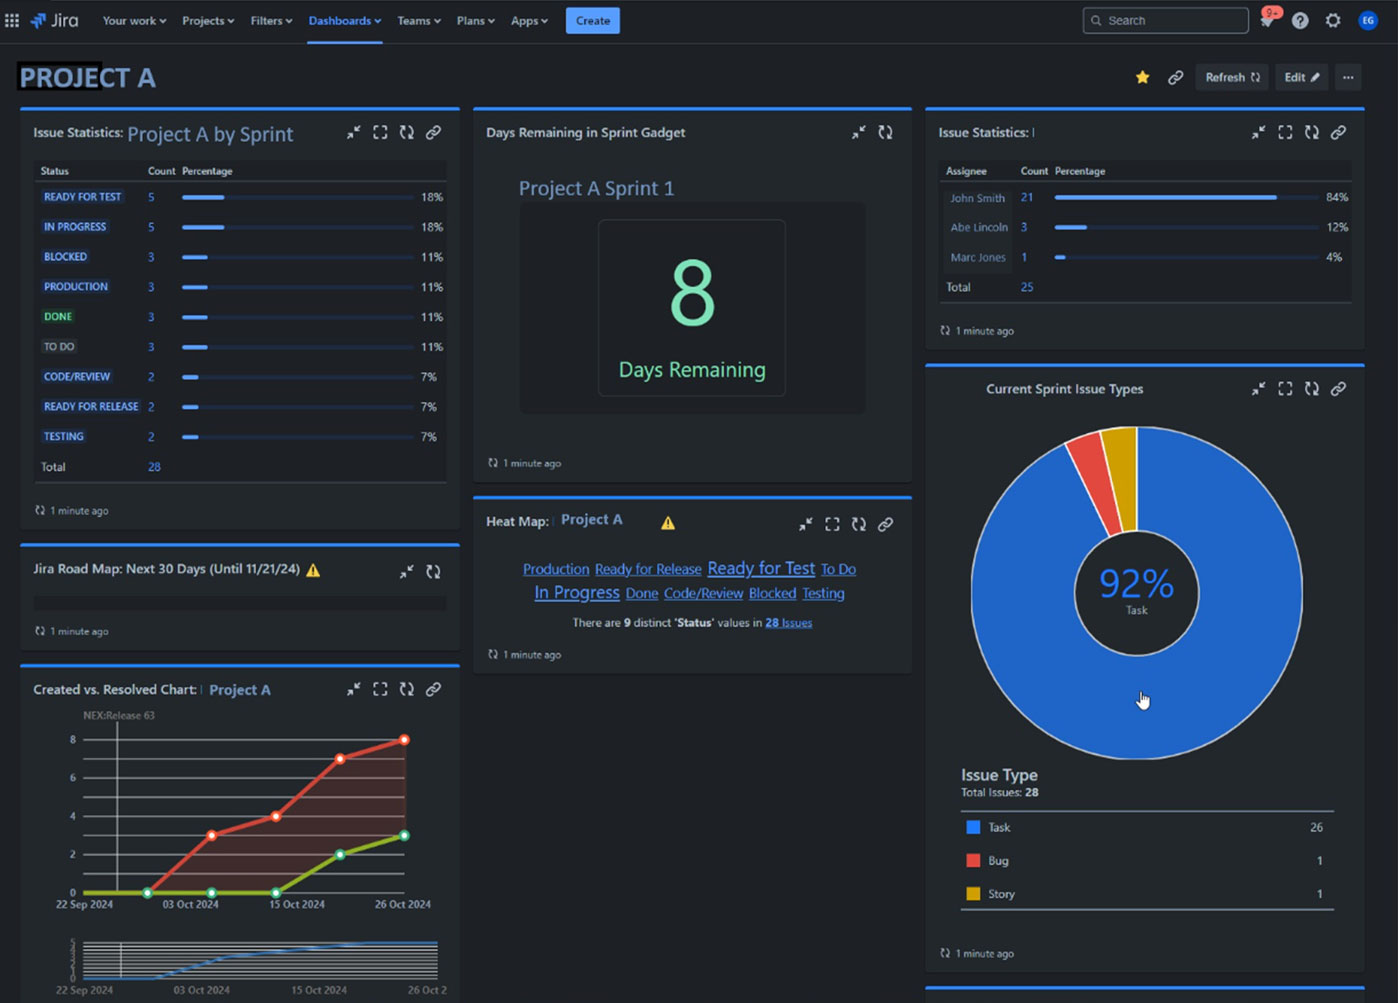
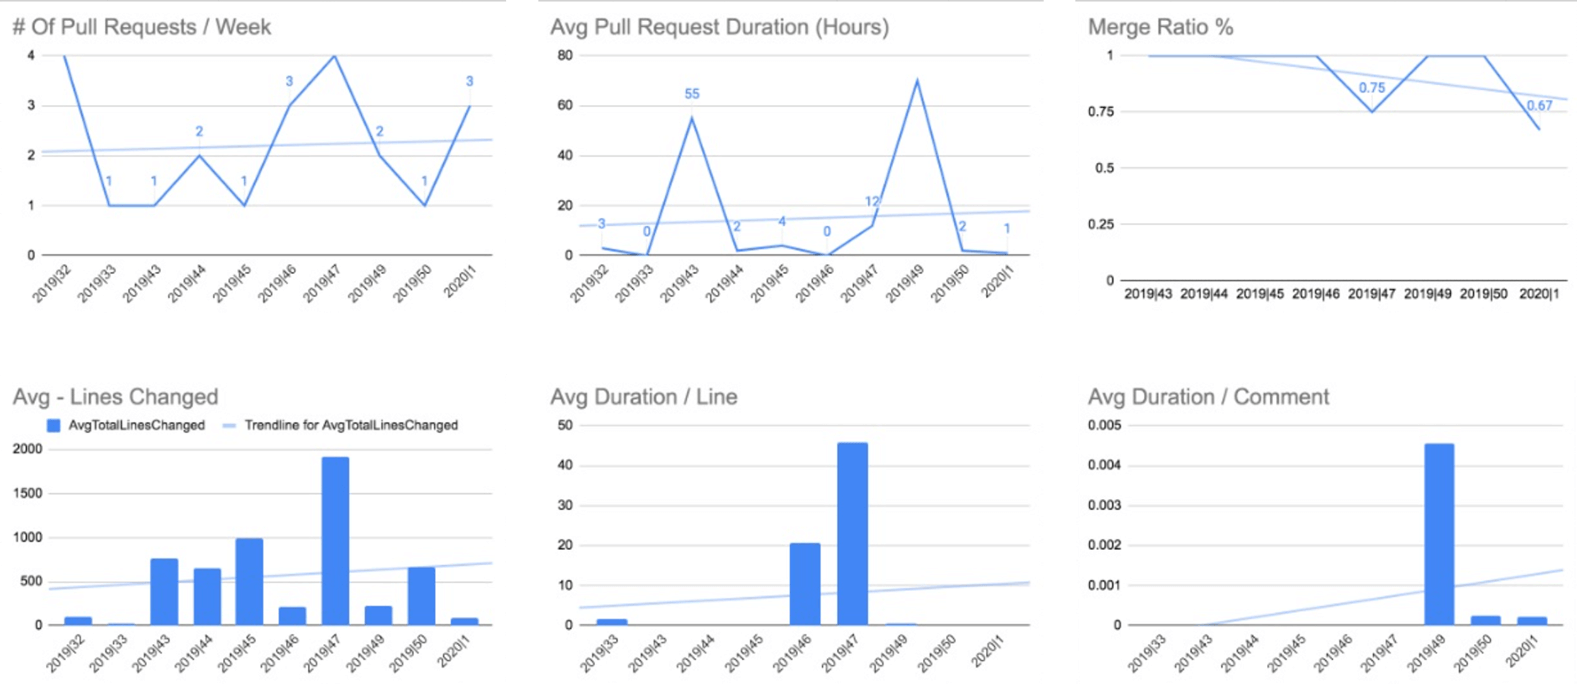
Dashboard Examples for Project Management
Example of MS Excel for Project Management with Automatic Jira Data Source Plug-in

for Project Management

for Project Management

for Project Management

for Project Management


Why Trust Sonatafy?
With a track record of delivering exceptional results to leading companies, we’re confident in our ability to enhance your software. But don’t just take our word for it – let us prove it to you with this risk-free offer.


Matthew Hensrud
Senior Director of Platform Engineering
“The Sonatafy team has continually impressed us with the quality of their engineers — we have found excellent engineering leaders in their contractors who have helped tremendously. They really are an integral part of our team, and we’re very thankful for Sonatafy’s professional leadership in this space. I heartily recommend them to augment anyone’s teams or projects.”

Chris Maresca
Chief Operating Officer
“We have been using Sonatafy for software team augmentation. Their vetting process is extremely through and has saved us a huge amount of time. All of the candidates presented have been outstanding and have fit into our team perfectly.”

Dave Wattel
Co-Founder
“The Sonatafy team consists of members who are dedicated, personable, and attentive. They will search tirelessly to match the right talent to meet your skills and budgetary requirements. Regardless of your situation, you cannot go wrong with Sonatafy.”

Jason Tuschen
Chief Executive Officer
“The entire team at Sonatafy greatly surpassed our expectations. We require very specific skill sets and the team did an incredible job of screening and selecting top – notch candidates. Sonatafy’s attention to detail, professionalism, open communication, and collaboration with us ensured that we found highly skilled talent that fit seamlessly into our company’s culture.”
Meet Our Developers
Review real engineer CVs of current and past Sonatafy Technology nearshore developers. We have a wide range of different positions and skills thanks to our talented engineers. Learn More.

Schedule Your
Complimentary Code Review
➜
Your Complimentary Review Includes:
Deep Dive Analysis ✔
Comprehensive Report ✔
Confidential & Professional Service ✔
